top of page
cargo-container-doors-in-blue-green-tone

HEYSENSE

- Z-Feed -

semi-truck-on-the-road-PYMEFTJ.jpg

61 years of

+

COMBINED EXPERIENCE

We have the know-how you need.

Search

Charge Air Coolers are used to improve engine efficiency by increasing intake air density from the turbo. This increase of air density allows better combustion per cycle, which increases horsepower. Checking the Charge Air Cooler is important.


To verify the performance, pressurize the Cooler to 20-25 PSI (Pounds per Square Inch). If you want to know the pressure on the CAC 4” plug during the test, refer to this formula:

  • 3.1416 multiplied by the radius squared

  • 2 x 2 x 3.1416 = 12.56 sq. inches

  • 12.56 x 20 PSI = 251 lbs. of force

Based upon the force inherent with this test make sure you anchor the plugs, beyond clamping, so that they don’t blow off during the test. If only testing the CAC and piping to the engine intake, plug the hose at the intake manifold. If you leave it connected, then air could leak through the engine at the rings, valves or if the engine is at valve overlap, then just rotate the crank a bit to resolve.

The cooler performance is generally considered acceptable if it exhibits less than a 7 PSI loss in 15 seconds. Check with your OE for requirements. Small leaks are to be expected, but if excessive, could cause issues noted below:


1. Loss of power

2. Decrease in manifold pressure

3. Higher coolant temperature

4. Decrease in fuel economy

5. Whistling from the radiator area


Rule of thumb, if the manifold temperature is within 40-50 degrees of ambient, then it could be assumed the CAC is working as designed.

When purchasing a replacement cooler, I would recommend asking if the performance is equal to or better than the original equipment manufacturer’s product. If the cooler does not meet the engine manufacture efficiency requirement, then performance can be sacrificed. You might check the cooler prior to installation.


Note: Using a winter front reduces the efficiency of the CAC, thus should be used only if absolutely necessary. Winter fronts allow cold ambient air in small areas across the face of the cooler, which stresses the aluminum, which could cause cracking. Charge Air temperatures could be in the 400 F range at around 40 PSI.


Have you ever looked at a torque curve? Its quite amazing what it tells us about the engine performance. If you have never seen one, here are the basics of the design. Torque is listed in increments up the RH side of the graph. RPM is listed in increments across the bottom of the graph. The torque curve, the orange graphed line, defines the intersect of torque at given RPM points.

  • The engine associated with this example curve idles at 600 RPM, as illustrated by the initial point at the far LH side of the curve.

  • This engine creates a maximum of 1650 ft. lbs. of torque, as illustrated by the highest portion of the curve.

  • Peak torque is achieved at 950 RPM, which is the point at where maximum torque, in this case 1650 ft. lbs., is achieved.

  • The green area is the sweet spot, which is where the manufacturer wants this engine to do most of its work, where it is efficient.

  • Maximum torque can be used all the way to 1430 RPM (approximately). At this point the torque begins to drop off. This is realized as a loss of pulling power.

This is all good, but most people speak about horsepower, how do we know what that value is? The equation is simple: HP = Torque X RPM / 5252 (this value is a constant)


HP = 1650 X 1430 (max RPM) / 5252, or HP = 450


So, with another engine, where the torque was also 1650 ft. lbs., higher horsepower is achieved by extending peak torque to a higher RPM. If 1650 was extended to an RPM of 1550, then the math would tell us that engine is around 485 HP. This curve would permit the driver to operate the engine at a higher RPM, because they would not be losing torque. Keep in mind, the operation would be further from the recommended operating range, meaning some efficiency is lost. In this case, that loss is fuel economy. The higher RPM that the engine operates at, beyond the Sweet Spot, the more fuel that is burned to maintain torque. Which may not be objectionable, depending upon what the expectation is.

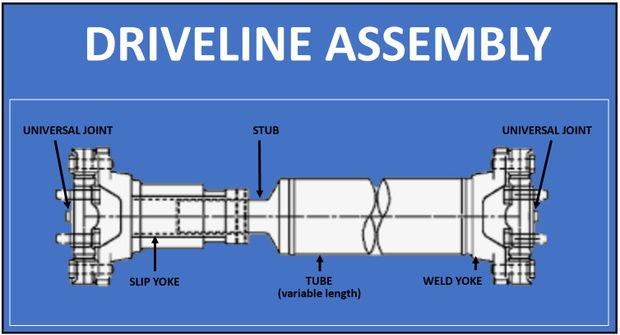
Every fleet owner is excited about reduced maintenance. A responsible service manager understands that this does not mean you can turn a blind eye to the maintenance-free components. As an example, maintenance-free drivelines eliminate the need for greasing. As such, the products provide no grease zerks, but that does not mean no inspections.


You should always adhere to the manufacturer recommendations with regard to inspecting the products for wear and operational incurred damage. Some products require inspection every 25K miles and others every service, refer to the product manual for intervals. For drivelines it is important to check any play in the U-joints or slip shafts and document your findings. Full or half round yokes have the same tolerances. To check the yokes, move them up/down, and side to side with at least 50 lbs. of force. Basically speaking, there should be no free play. Most documents indicate .006” using a dial indicator, but my thought is if you feel anything, it’s time to replace the joint.


If it is necessary to disassemble the driveline and slide out the slip shaft, make sure you mark both pieces in an effort to avoid mistime within the assembly. As drivelines rotate and age, center bearings have a tendency to wear. You want the driveline aligned as it has previously worn when you put it back together.


Spicer has a nice calculator online to find operating angles for each u-joint. See link below. If you have another manufacturer, ask the product rep for direction.

bottom of page